
Techniques > Research > Ultrasonic Hull Thickness Measurements
Research - Ultrasonic Hull Thickness Measurements
Version date: 16 October 2016
Introduction
An ultrasonic thickness (UT) gauge can be used to measure thickness of metal and many other solid materials so this instrument can be used to measure the thickness of metal remaining in iron and ship hull structure and plating. Background information on making hull thickness measurements with a UT gauge can be found in Techniques: Ultrasonic Thickness Measurements.
The use of UT gauges for measuring plating thickness on floating vessels is common and the expected results are well known. However, publications that referred to the use of ultrasonic thickness measurements on shipwrecks often reported that problems occurred when making the measurements. These tests were designed to investigate these problems and to help formulate good practice for the use of UT gauges in underwater cultural heritage projects.
Sponsorship was obtained through the US charity research foundation ProMare and Cygnus Instruments to purchase a Cygnus DIVE II gauge and a set of probes for this investigation.
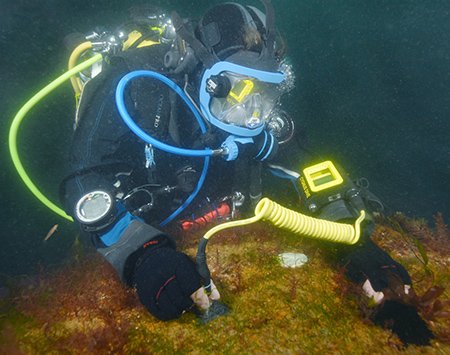
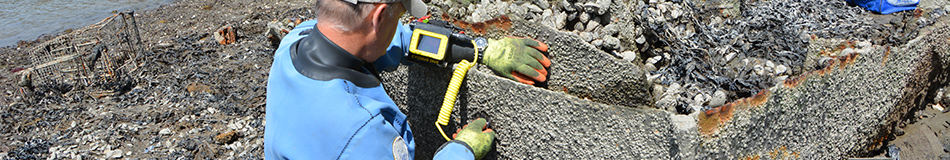
Fig 1: Measuring hull plating thickness underwater

Fig 2: The Cygnus DIVE II underwater ultrasonic thickness gauge
Aims and Objectives
The aims of the experiments were:
Test 1: To determine the effects of different types of ultrasonic thickness probe
Test 2: To determine the effect of different metal surface preparation methods
Test 3: To develop an operating methodology
Test 4: To determine measurement quality on typical corroded metal surfaces
Test 5: To experiment with the use of lower cost epoxy putty for filling in concretion holes at test points
Experiments on the use of the UT gauge were undertaken on land using iron and steel test pieces, on the foreshore wreck of a WWII steel ammunition barge and on the hull of HM submarine A7.
Equipment and Method
The instrument chosen for this project was the DIVE Mk2 underwater ultrasonic digital thickness gauge made by Cygnus Instruments Ltd., this instrument is robust, small and lightweight so can be worn on the diver’s wrist (Fig. 2). The gauge is automatic in operation so there are no controls to adjust before making a measurement, this is an advantage when time on site is short and also makes the instrument very easy to use.
The gauge can be fitted with different types of probe so we undertook experiments to determine the effectiveness of each type on corroded plating. The gauge display shown to the operator is easily understood and provides essential feedback about the quality of the ultrasonic signals being received and the measurements that have been made. An optional upgrade to the basic gauge is the ability to store up to 5000 thickness measurements in its internal memory, arranged in groups selected by the operator, the measurements are automatically logged when a stable measurement is made so the operation is hands-free.
Once the measurements have been made the logged measurements can be uploaded in to a computer for display and annotation using the Cygnus Instruments CygLink software that is supplied with the gauge. Once any annotations have been added the CygLink software can be used to produce a report in PDF format or the measurements can be exported to a spreadsheet.
Test 1 - Choice of Probe Type
Method
Three probes were tested in the following experiments, one single crystal probe and two twin crystal probes that transmit at different frequencies. The number of crystals fitted in to the probe determines its more of operation and the frequency determines how thick a material can be measured and the resolution of the measureements. Each type of probe is fitted with a plastic band of a particular colour so it is easy to tell them apart:
- Probe 1: S2C Single crystal 2.25MHz, standard probe, red band, 3-250mm thick steel
- Probe 2: T5B Twin crystal 5.0MHz, for heavily corroded steels, yellow band, 1.5 - 50mm thick steel
- Probe 3: T2C Twin crystal 2.0MHz, Cast iron, plastics, blue band, 2.5 - 150mm thick steel
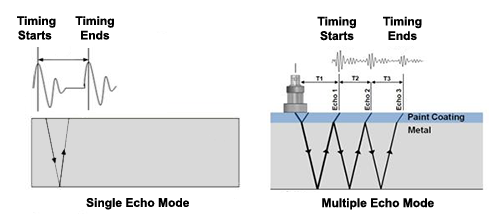
Fig 3: Single and multiple echo modes
The single crystal probe is the traditional design that works in ‘multiple echo’ mode (Fig. 3). For multiple echo measurements the ultrasound pulse is first transmitted from the probe into the material under test. The transmitted pulse reflects off the back wall of the material, returns to the front face of the material, is detected by the probe and the clock within the gauge is turned on. The returned echo then reflects off the front face, again reflects off the back wall where it is detected again and the time elapsed is recorded in the memory of the instrument. The returned pulse reflects off the back wall for a third time and is again detected by the probe, simultaneously the gauge begins to time the third echo. With this method the probe detects three equally-spaced return echoes from a single pulse transmission where the time spacing of the echoes is proportional to the material thickness. The strongest reflections occur within the test material so this method will ignore coating thickness and the need to detect three pulses provides an in-built means of quality control for the measurements. The drawback of this method is that a large amount of transmitted signal has to be coupled into the material, a signal level that is sufficient to overcome the absorption and scattering that occurs at each reflection and within the test material itself.
The alternative is a twin crystal probe that uses two crystal transducer elements, one to transmit the signal and a second receiver crystal that is fitted alongside it in the probe. With this type of probe a thickness measurement can be made with a single transmission and back wall echo (Fig. 3). The transmit pulse from the probe passes into the test material, reflects off the back wall and is detected back at the probe, with the time of flight of the signal proportional to the thickness of that material. As a single echo is used to make the measurement there is no inherent quality control of the measurements as the thickness of any coatings will be included in the measurement, so this method should only be used on bare metal. However, only a single reflection is required to make a measurement so less power has to be coupled to the test material for a measurement to be made. This method is acoustically more simple than the multiple-echo method, is more likely to work under marginal conditions but provides no built-in quality control.
The probes used for the tests transmitted different acoustic frequencies. High frequency pulses travel a shorter distance through the test material than low frequency pulses but the resolution of the high frequency measurements is finer, so lower frequencies will work better on thicker materials but will give less precise measurements. For plate thickness measurements where the distances to be measured are small we would tend to use the higher (5.0MHz) frequency probe but the lower (2.0MHz) probe was tried as well to see if it would couple the transmit pulses to the test material more readily. For both probes the reported resolution of the measurements is ±0.05 mm on the High setting and ±0.1 mm on the Low setting in the gauge.
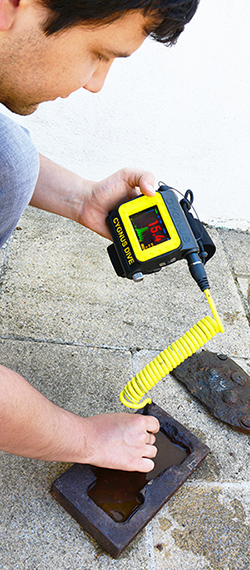
Fig 4: Making test measurements
Ultrasonic thickness testing for heritage applications differs from typical applications of this technique in that measurements are attempted on iron and steel with surfaces that may be heavily corroded. There are a number of problems that occur when measuring the thickness of corroded metal. One of the most significant problems is the difficulty in coupling or transferring the transmitted acoustic signals from one object to another, such as from the probe to the test material. At the interface between the probe and the material some of the acoustic signal will be absorbed or scattered, so how well the probe is coupled to the test material makes a big difference to the ability to make a measurement. A couplant is needed between the probe and the test material which the water itself provides when underwater and a gel is used on the surface, so this forms part of the acoustic path between probe and material. The metal surface the probe touches may be uneven or pitted which will reduce the amount of acoustic signal that can be coupled in to the test material. The back face of the material may also be uneven so much of the acoustic signal may be scattered rather than reflected back. A poor coupling between probe and material also requires the return echo to be stronger so that enough signal strength can couple back in to the probe to be detected. The oldest materials provide the biggest difficulties as the material being measured may contain so little sound metal that it is too thin to be measured reliably. The higher resolution 5MHz twin crystal probe cannot measure metal thinner than 1.5mm.
A number of different tests were run using the three probes which aimed to evaluate their use on a range of typical iron and steel hulls, the results of the tests to determine the quality of the measurements are described below in Test 4. The other aspect considered was the effectiveness of each probe in actually making a measurement as it soon became apparent that on corroded metal surfaces it was difficult to obtain any measurements using the single crystal probe and the multiple echo method.
A range of metal test pieces were tried that had a range of ages and degrees of corrosion (Fig.4). As expected, all three probes provided reliable measurements on clean, smooth and corrosion-free metal. On pitted steel the twin crystal probes (probes 2 & 3) would give a measurement quickly where the single crystal probe (probe 1) would need to be coaxed into making a measurement by moving the probe around the metal surface until a suitable place was found. This meant that often a larger area of metal had to be cleaned before a measurement could be made using probe 1, causing more disturbance to the concretion than was desired. On a material with more advanced corrosion the twin crystal probe would provide a measurement when the single crystal would not. On the thinnest metal the higher frequency twin crystal probe (probe 2) was more reliable than the lower frequency (probe 3). The results of these tests are in agreement with the previous prediction based on the limitations of each probe and its method of making a measurement.
Test 1 Conclusions
Although the single crystal probe (probe 1) could be used to make thickness measurements of some of the partly corroded metal test pieces the twin crystal probes (probes 2 & 3) could be used on metal that was in worse condition. The twin crystal probes often provided measurements more quickly and directly than the single crystal probe; a significant point when working in deep water where time on site is at a premium. Only a small area of concretion needed to be removed for the twin crystal probes whereas a larger area was often needed for the single crystal before it made a successful measurement.
Test 2 - Surface Preparation Methods
 450.jpg)
Fig 5: Sample hull plating showing thin grey concretion over very pitted and corroded steel plate
Method
An ideal method of measuring plate hull thickness would involve no preparation of the material before measurement so that the material would not have to be disturbed and no valuable dive time would be spent in preparation. If surface preparation must be done then it needs to take as little time as possibleand it should also not require the use of complicated or expensive tools or tools that require extensive operator training.
Previous work has shown that any surface concretion layer has to be removed from the test area and it be cleaned down to bare metal. Russell et al. even suggest that preparation should include buffing and grinding to make the surface as smooth as possible, however this would be unwelcome as it would require the use of power tools underwater and would remove some of the thickness of material that was being measured. During work on the submarine AE2 in 86m water depth a pneumatic needle gun was used to remove concretion, a logistically complicated method that required an operator trained in the use of the tool, equipment to power the tool plus the problem of managing long hoses in deep water. These surface preparation tests were designed to establish how little preparation could be done while still being able to make useable measurements.
All three of the ultrasonic probes supplied with the Cygnus unit were tested, the single crystal (multiple echo) probe and the two twin crystal (single echo) probes. Five methods of surface preparation were evaluated on a steel block test piece (Fig. 4):
- Surface 1. Unaltered - one area within the concreted recess was left in its untreated state with any corrosion or concretion left intact
- Surface 2. Soft brush - this area was brushed with a soft plastic brush then rinsed with fresh water
- Surface 3. Wire brush - this area was brushed vigorously with a wire brush then rinsed with fresh water
- Surface 4. Hammer and chisel - concretion was removed from a small area and cleaned down to bare metal just using a 20mm chisel and lump hammer
- Surface 5. Drill - an electric drill was used to make holes of increasing diameters through the concretion down to the bare metal below.
Results
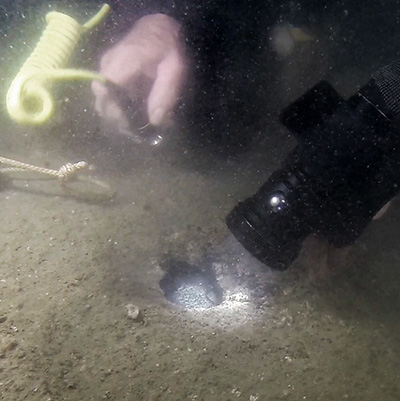
Fig 6: UT measurement about to be made in a small hole chiselled through the concretion on the hull of A7
With both the unaltered Surface 1 and Surface 2 cleaned with a soft brush no useful measurements were able to be taken of the material with either the single or twin crystal probes. The probes did not receive any ultrasonic signal through the concretion.
With Surface 3 cleaned with a wire brush no consistent measurements were made of the core material. The single crystal probe did not receive any ultrasonic signal through the concretion but the twin crystal probes did occasionally register a reading. However the thickness recorded was much smaller than the known thickness of the object and less than half the thickness recorded with callipers. It is possible that these measurements may represent a measurement of the concretion only, or that the layered nature of the concretion has caused the acoustic signal to be deflected and therefore given a false reading.
The hammer and chisel was used to remove concretion from Surface 4. Concretion was most easily removed using gentle taps with the chisel held at right angles to the metal, with the metal surface then cleaned as much as possible of any remaining concretion using more light taps on the surface with the chisel. This method produced the most reliable, repeatable measurements using the twin crystal probe but the results were inconsistent with the single crystal probe. For the twin crystal probe the concretion was removed over an area just large enough to admit the probe so it could touch the surface of the bare metal. For the single crystal probe a larger area was needed on the lower quality samples before a place could be found where a successful measurement could be made.
Surface 5. Drill - This method when used with the twin crystal probe produced some results, however they were not repeatable in all cases. Tolerances were often within the 0.5mm range, but measurements which were outliers could be in error by as much as 3mm so it is not clear what distance the instrument was actually recording. No successful measurements could be made using the single crystal probe.
Under our test conditions we found that meaningful measurements could not be obtained from preparation methods 1‐3; unaltered, soft brushed and wire brushed.
Method 5 used drills of increasing sizes to put holes through the concretion, where all the holes were smaller than the diameter of the front face of the probes. This method was tried simply because it would be less destructive to the surrounding material than using a hammer and chisel. The method was unlikely to work because of the difficulty in transmitting the ultrasonic signal from the probe, down the small hole through the concretion, in to the bare metal, reflected off the back wall of the metal then back out of the hole to the probe. Using a large diameter drill caused its own difficulty as the pointed end of the drill would be within the base metal layer before the hole had been drilled clear, and the conical blind hole in the metal stopped any thickness measurements being made. This method may work if a flat faced end milling cutter is used to make the hole, one slightly larger in diameter than the diameter of the probe face so the probe can sit flush with the bare metal. Drilling the concretion to make a hole through it may be less disruptive to the material than hitting it with a hammer and chisel but would require the provision of a power source and hoses which would make this method more logistically difficult. Drilling may also be able to penetrate particularly hard concretions that are difficult to remove with a chisel.
Method 4 using a chisel to remove an area of concretion and expose the bare metal beneath produced the most reliable results on the surfaces we tested. The concretion on the test block was quickly and easily removed with hand tools so this method is also very simple. Unlike methods requiring the use of underwater power tools, this method requires no surface support, power pack or hoses.
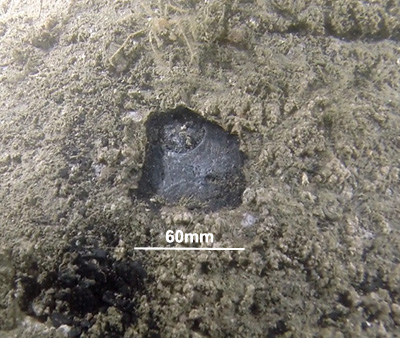
Fig 7: 60mm hole in the 6mm thick concretion on A7 showing bright but uneven metal underneath
On the metal structures we have tested so far there has been a wide variation on the nature and composition of the overlying concretion scale, with some much thicker than others and some more firmly attached to the base metal. Although the hammer and chisel method worked on these surfaces, power tools may need to be used on other wrecks if the concretions are very firmly attached to the base metal.
Test 2 Conclusions
The tests showed that reliable measurements could only be made with the concretion removed from the bare metal. In all cases we found that the ultrasonic signal from the probe did not penetrate even the thinnest concretion layer, suggesting that the layered nature of the corrosion layer or the interface between base metal and corrosion layer are such that they do not allow the transmission of ultrasonic signals at the frequencies used by the UT gauge. It has been reported that measurements have been made through particularly tough concretions on the AE2 submarine but this reported the thickness of the concretion and the base metal, so this was of little practical use.
After removal of the concretion the underlying metal tends to be pitted and uneven so it may be this that limits the effectiveness of any UT gauge (Fig. 5). The UT probe needs to be coupled to the base metal on a flat and smooth surface so that the probe does not move and so there is no gap between probe and metal to cause acoustic scattering and reverberation. Even the smallest variation in the surface of the bare metal will hinder the probe from being replaced in exactly the same position and orientation when taking the same measurement twice, so the variation in repeat measurements may be more to do with surface roughness than actual variation in metal thickness. In practice what this means is that on rough metal surfaces there is a limit to how precisely we can measure the thickness of the metal.
Test 3 - Measurement Procedure
Method
The difficult conditions on the A7 submarine site with its poor visibility, low light and deep water led to operational problems when making measurements. There were just a few minutes available to make UT measurements on any dive, low visibility hampered recording work and nitrogen narcosis affected the ability of the divers to think clearly. Therefore it was crucial that the divers using the UT gauge became familiar with its use on the surface and in shallow water before making hull thickness measurements at depth on the submarine.
The UT gauge was purchased with the additional data logging option so the measurements made underwater could be recorded by the instrument then inspected later in more detail on the surface. Automatic logging was to be used in preference to recording on a dive slate as it would be quicker for one diver to do, as the second diver of the pair would be occupied holding lights to illuminate the work area. Once the test area had been cleaned back to bare metal the measurements could be made. The initial plan was that the diver making the measurements was to place the probe on the metal surface, wait until the measurement stabilised sufficiently for the gauge to log it, then move the probe away from the metal to reset the gauge for the next measurement. This process would be repeated at least three times at each measurement point so an idea of measurement quality could be assessed.
In practice both methods had to be used, both automatic and manual logging. The problem was the roughness of the metal surface allowed the probe to wobble very slightly, which caused instability in the measurements from the gauge, and if the measurements were not sufficiently stable they would not be automatically logged. For the AutoLog feature to record a measurement, the DIVE gauge needs to receive 2 seconds of stable measurements, so 16 measurements in total at a rate of 8 per second. Stable measurements show a change less than or equal to two times the resolution setting, with resolution set to 0.1mm (Low) logging will trigger when the readings fluctuate no more than 0.2mm for 2 seconds. Once a measurement had been successfully logged the diver has to release the probe from the surface for a period before the AutoLog would record another measurement.
The display on the gauge reports the quality of the measurements by colouring the text showing the current thickness measurement, with red representing a poor measurement and yellow a good measurement. When the measurements were sufficiently good to be logged a yellow bar is shown across the screen and the last logged measurement value is shown in the corner of the display. Once a single measurement is made it is essential that the diver moves the probe away from the metal surface for 2 seconds before attempting the next measurement. If measurements are attempted too quickly then the AutoLog feature in the gauge does not re-arm and the subsequent measurement is not logged. Once this was discovered and the operating procedure was changed the problem no longer occurred.
We did experiment with placing a thin layer of soft, plastic material over the probe face in the hope that it would help dampen any rocking motion of the probe on the rough, corroded metal surface. Unfortunately the soft material acted just like any other coating and stopped any single echo measurements being made.
Test 3 Conclusions
In discussion with the manufacturer, the conclusion was that the small variation of measurement values from the same sample area is an inherent feature of the single echo method and if it were possible to use multiple echo this would eliminate this problem. Using the multiple echo method the probe can be rotated in the same place on the test site and the reading remains consistent as the sound pulse is being sent into and out of the material in a straight line. Whereas with the twin crystal probe and the single-echo technique the sound is being sent in a V shaped path, so when the probe is moved slightly the sound path is altered and the measurement value changes accordingly. Once a single measurement is made it is essential that the diver moves the probe away from the metal surface for 2 seconds before attempting the next measurement.
Test 4 - Measurement Quality
Method
The initial tests using the gauge showed a variation in the measurements made at a single point on metal with a rough or pitted surface which is a surface type typically found on corroded iron and steel from shipwrecks. This variation in values is significant; if measurements made at a single point vary then it affects our confidence in any measurements made on any other part of the same hull. If the same thickness measurements are repeated at a later date and are used to estimate rate of corrosion then it is essential that the measurement error is estimated, otherwise inherent variation in the measurements may be misinterpreted as an actual change in metal thickness. Tests were undertaken by the project to determine the quality of measurements under different conditions as a means of establishing the measurement error.
The ability of the gauge to detect the ‘true’ thickness measurement is dependant on a number of factors. Using the single echo method, the thickness measurement is defined by the leading edge of the first echo or first return from the back face of the material under test. With homogenous material that has smooth front and back faces it is usually straightforward to determine where this point is in the record, but it becomes more difficult as the quality of the material and surfaces degrade. The echo returns from smooth faced homogenous material tend to be a much higher amplitude than the background noise but as the material degrades the strength and quality of the return echoes reduce. Amplifying the return echoes allows them to be detected but this process also amplifies the background noise, eventually the echo signal becomes so weak that it is lost in the background noise. The ability to make a thickness measurement is controlled by the ratio between the amplitude of the echo signal and the amplitude of the noise, known as the Signal to Noise ratio or SNR.
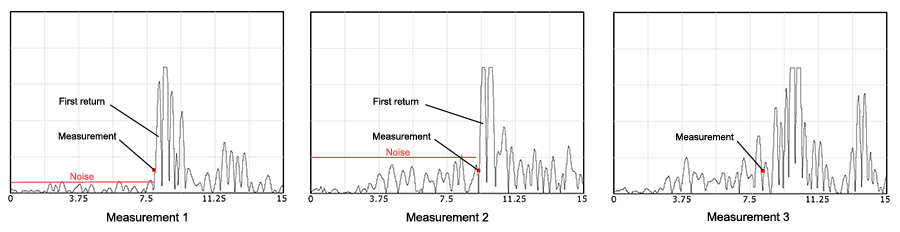
Figure 8: The effects of Signal to Noise Ratio (SNR) on the ability to make a measurement (1. Good, 2. Adequate, 3. Poor)
- Figure 8 shows the effects of decreasing Signal to Noise ratio on hull thickness measurements. Each of the three time-series plots shows one single echo measurement and each shows the returned signal level over time. For measurement 1 the gauge records the background noise level for a period of time before the first return echo is seen as a peak on the plot, the time between zero and the first return is the time the signal takes to travel from the front wall of the material to the back wall then back to the front wall again where it is detected. Any time before the first return arrives the gauge will just be recording the background noise. When the first return arrives the gauge detects it using a built-in set of rules to decide at precisely what time the signal is considered to have arrived.
- For Measurement 2 in Figure 8 the background noise is stronger in the period before the first return arrives. In fact, the background noise is the same but the signal has been amplified so that the weaker first return can be detected, unfortunately by amplifying the signal you also amplify the noise. Again the gauge uses its rules to determine where the measurement has been made then reports the measurement value.
- For Measurement 3 the return signal from the back face of the material is weaker still so the gauge has to amplify it further to be able to detect it. Here the signal level is so weak it is hard to tell where the noise stops and the reply signal starts so the gauge is operating at the limits of its capability.
As we can see above, the ability to make a measurement degrades with material quality on a sliding scale with repeatable, clear measurements at one end of the scale and no measurements possible at the other. In between the two extremes lie a range of materials and surfaces where the ability to make a measurement is inconsistent and the reliability of the measurements is less certain.
The SNR is the ratio between the background noise and the signal level received by the gauge, so this is affected by a number of factors:
- Signal power transmitted by the probe
- The amount of signal coupled into the front surface of the test material
- The amount of signal reflected back by the back surface of the material
- The amount of signal coupled back into the probe
- The noise in the instrument
The signal level transmitted by the probe is sufficient for normal operation and making the transmitted power higher would bring in other unwanted side-effects. The instrument will be designed to minimise its own self-noise so this too cannot be improved. The other factors are the ones that affect the ability to make thickness measurements on corroded shipwrecks. The ability to get sound from the probe and into the test material is directly related to the roughness of the material surface so the rougher the material the harder it is to get the signal into the material. The same applies on the return journey as it it harder to get the signal back from the material to the probe when the surface is rough. The roughness of the back surface of the material also limits how much signal is reflected back rather than being scattered away in all directions. So to summarise, as the surfaces of the test material degrade it becomes harder to couple the signal into the material, the SNR decreases and it then becomes difficult to make reliable measurements.
As the material quality degrades the strength of the return echoes is likely to get weaker (SNR gets smaller), so the probability of successfully making a measurement decreases and the probability increases that any measurement that is made is incorrect. This is an inherent feature of all measuring instruments and not something peculiar to ultrasonic thickness gauges, or the DIVE gauge in particular. Unfortunately it is corroded and rough hull plating that we wish to measure so often these instruments will be working at the limit of their capability when doing UCH work..
The following tests have been designed to demonstrate what happens to the measurements from each type of probe as the quality of material degrades from ideal to poor. The DIVE gauge data logging option records the acoustic response measured by the probe so the quality of the signals used for each measurement can be inspected after the dive using the Cygnus CygLink software. Below are a series of test results shown as plots of signal strength against time measured by the probe and recorded within the gauge. Each plot represents one single measurement and the red dots on the plots show where the gauge has determined the thickness measurement to be.
The tests were done using all three probes:
- Probe 1: S2C Single crystal 2.25MHz, standard probe, red band
- Probe 2: T5B Twin crystal 5.0MHz, yellow band
- Probe 3: T2C Twin crystal 2.0MHz, blue band
Test 4a
The first test was to investigate the behaviour of the probes under ideal conditions to demonstrate that any significant variation in measurements is not caused by the instrument itself. The measurements were made on a 15mm thick steel test piece with smooth surfaces on both the back and the front. The three plots below (Fig. 9) show the records from each of the three probes for a single thickness measurement of the steel test piece.
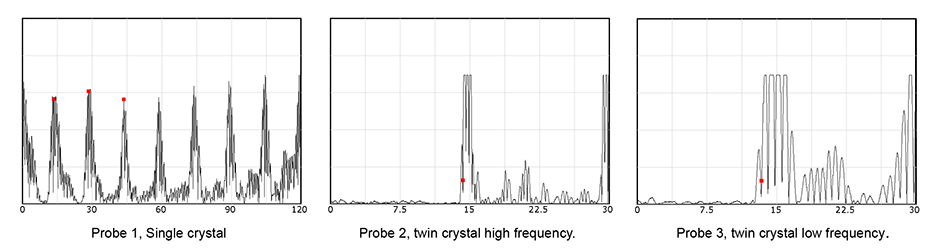
Figure 9: One measurement from each of the three probes on the 15mm test piece, showing an ideal signal response for each probe
Probe 1 shows a number of evenly spaced peaks which represent the multiple echoes within the steel measured by the single crystal probe; this is multiple echo mode where the acoustic signal has reflected multiple times inside the steel test sample. Each of the peaks represents an echo received at the probe. The three red dots at the top of the first three peaks identify the three peaks used to determine the time of flight of the pulse and thus the thickness of the steel. Note that the peaks are narrow, clearly defined and evenly spaced as this measurement has a good SNR.
Probe 2 shows the response for the high frequency twin crystal probe recording the single echo from the back wall of the steel test piece. Again the peak in the response is narrow, clearly defined and considerably larger in size than the background noise, so also shows a good SNR. The red dot shows where the measurement value has been recorded.
Probe 3 shows the same result as probe 2 except that each peak is wider as the peak width is a function of the frequency used for the ultrasonic pulse.
Making the same measurement multiple times with each probe gave the expected high level of repeatability and low measurement error; the measurement resolution in the gauge was set to 0.1mm and all the measurements from each probe agreed to within 0.1mm.
Test 4b
By repeating the same test on steel block approximately 35mm thick with surface rust but no pitting we could start to see some variation in repeat measurements (Fig. 10):
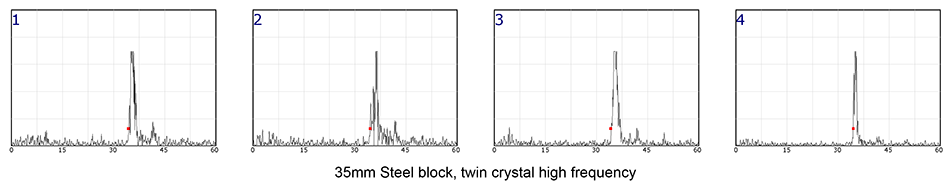
Figure 10: Four measurements made with the high frequency twin crystal probe (2) at the same point on a 35mm thick steel block
Note that the peaks are less well defined, especially measurement 2, and the background noise level has increased between the transmission at T0 and the first return around 35mm distance. The measurements reported in this set are 35.0, 35.1, 34.8, 35.2, but the plot for measurement 4 at 35.2mm appears to be of the highest quality (narrowest and with well-defined edges) so should be considered to be the most reliable.
A similar response was given by the low frequency twin crystal probe (3), but with the wider peaks as seen in Fig. 5.
The single crystal probe (1) when used at the same test point on the steel block gave three clear measurements and one that was of marginal quality (Fig. 11):
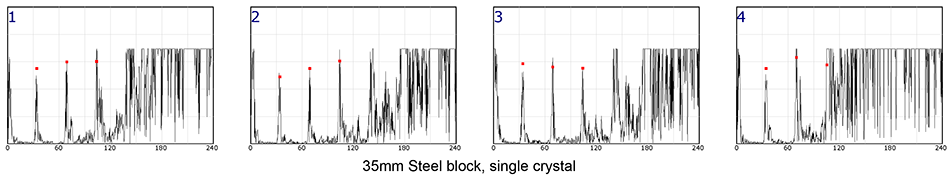
Figure 11: Four measurements made with the single crystal probe (1) at the same point on a 35mm thick steel block
For the first three graphs the three peaks that are required to make a measurement are clearly visible but the fourth peak is lost in noise, this gave measurements of 35.0, 35.0 and 35.0mm. In the fourth graph the third measurement is on the edge of the noise but the measurement is still recorded at 35.6mm. The multiple echo mode used here by the single crystal probe (1) is on the edge of being able to make reliable measurements. Three of the measurements agree to within tolerance but the fourth result shows that it is possible for this method to make an incorrect measurement when the material surface is poor and the SNR is low.
Test 4c
Both the test piece and the steel block were in good condition and gave the expected good results so the tests were then repeated on a sample more representative of the kind of material encountered on shipwrecks. The sample used was an 8.5mm (±0.2mm) thick section of boiler plate of unknown date that had a corroded and pitted surface.
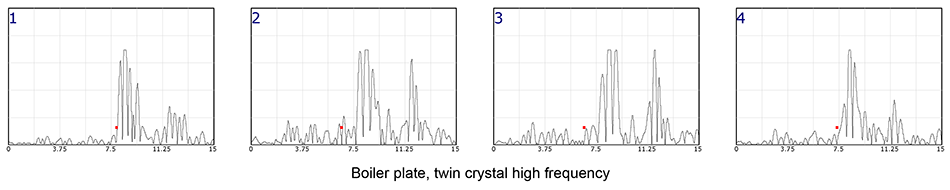
Figure 12: Four measurements made with the high frequency twin crystal probe (2) at the same point on an 8mm thick boiler plate
The recorded measurements were 8.4, 7.1, 7.1, 7.9 mm with two additional measurements at 8.4 mm not shown (Fig. 12). Note the increased amplitude of the background noise between T0 and the first return (red dot). Measurement 1 shows a clean echo return and of the four the first is likely to be the most reliable measurement. Measurements 2 and 3 have detected at a point on a small signal peak before the main peak while measurement 4 shows a less well defined first return. Here, the automatic detection of the first return has not been successful but inspection of the traces in post-processing has been able to identify the most reliable value for the measurement.
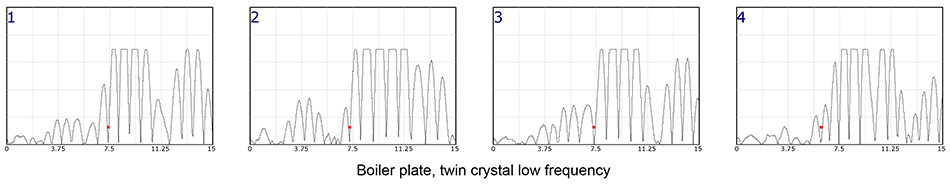
Figure 13: Four measurements made with the low frequency twin crystal probe (3) at the same point on an 8mm thick boiler plate
The low frequency twin crystal made three measurements of 8.5, 8.2, 8.3 and 7.0mm (Fig. 13). In measurement 4 the gauge has detected early on a smaller peak. Note that in the first measurement the background noise before the first return is now more than a quarter as strong as the first return, so the SNR is now poor and the ability to make a reliable measurement is degraded.
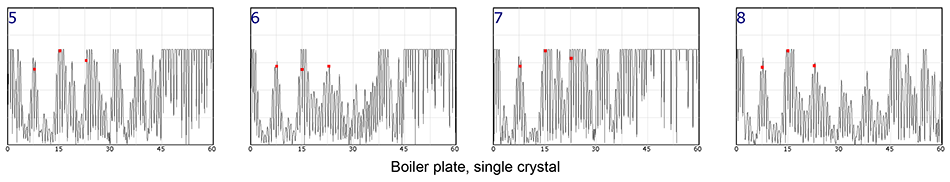
Figure 14: Four measurements made with the single crystal probe (1) at the same point on an 8mm thick boiler plate
The measurements from the single crystal show a smaller variation in values than reported by the twin crystal probes: 7.6, 7.6, 7.5, 7.6 (Fig. 14).
The noise surrounding the echoes is very large so the SNR is poor, hence the confidence in the measurements should be poor, but the four measurements agree to within 0.1mm so may be more reliable than the four plots suggest. Although four measurements were made successfully it took considerably longer to make each measurement as the probe needed to be positioned in exactly the right place on the rough metal surface before the gauge would record a reading.
The conclusion that we can draw from this set of measurements is that it is harder to obtain a measurement on this quality of material using the single crystal probe but when a measurement is obtained then it is reliable.
Test 4d
Test 4d was done on the corroded steel hull of a Royal Navy A class submarine lost in 1914. Unfortunately, the quality of the steel hull on the HM submarine A7 was worse than the boiler plate sample and this poorer quality had a detrimental effect on the hull thickness measurements. For more details about the location of the test points please see Experiments in Ultrasonic Hull Thickness Measurements on the A7 Project.
Measurements were planned for 8 points on the hull of the submarine but only 5 were completed due to lack of available time on site. The tests above that were done prior to making measurements on the submarine showed that the high frequency twin crystal probe was likely to produce the best results so that is what was used on the hull. Each set of measurements were made one after the other with a minimal delay between them, with the probe moved off the hull and replaced each time, within an area only slightly larger than the area of the face of the probe to maximise repeatability. Note that the graphs below show a considerable variation in the amplitude response for what should be the same measurement.
Test 4d - UT5
Two attempts were made at recording a thickness at point UT5 as it was difficult to make a reliable measurement on the first attempt. Four measurements were made on the second attempt (Fig. 15):
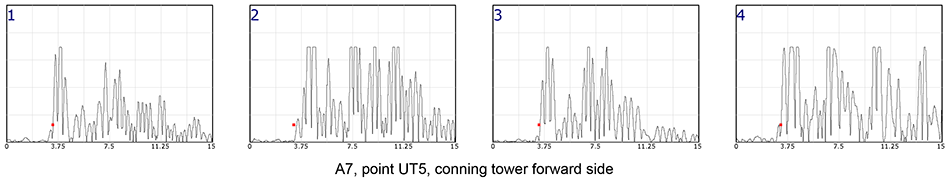
Figure 15: Four measurements made at point UT5 using the high frequency twin crystal probe (2)
The recorded values were 3.8, 3.6, 3.8, 3.7mm. The shortest of the three values is 3.6mm so it would be tempting to use this value as it is the worst case measurement for remaining hull plating. However, inspecting the trace for the 3.6mm measurement (Fig. 15:2) shows that here the gauge has detected at a point on a small signal peak that precedes the more reliable signal peak, which results in a short measurement. Again, this shows that with poor SNR measurements it is useful to be able to record the measurements for later interpretation.
Test 4d - UT1
Difficulties were encountered when attempting to make measurements at point UT1 on the starboard bow. The values reported by the gauge were not stable as the surface at this point was heavily pitted and moving the probe by the smallest amount would change the measured value considerably, as shown below:
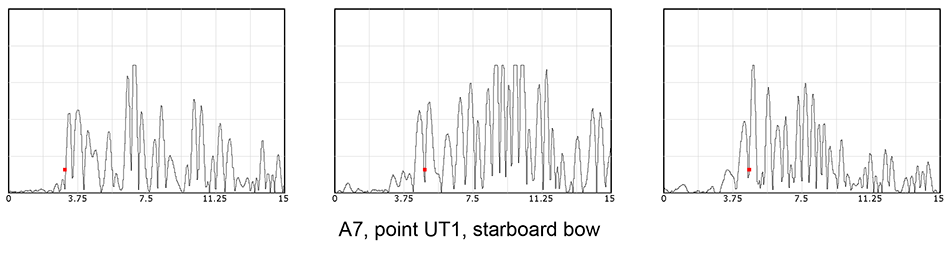
Figure 16: Four measurements made at point UT1 using the high frequency twin crystal probe (2)
Three measurements were made in two attempts with values 3.4, 5.4, 5.1mm (Fig. 16). In the first graph we can see that the gauge has determined the point to be at the left hand edge of two peaks of similar amplitude giving a value of 3.4mm. In the second measurement it has determined the point to be between the two peaks and has recorded a longer measurement of 5.4mm but the third measurement of 5.1mm looks the most reliable of the three. There is no clearly defined first return in any of the three plots as the instrument is attempting to make measurements within the background noise and is operating at the limit of its capability.
Test 4d - UT8
Point UT8 on the starboard stern provided three measurements with a range of values: 8.8, 9.7 and 9.8mm (Fig. 17). Inspecting the plots we can see that in the first two the gauge has detected on noise before the main peak and only in the last plot can we see a clearly defined first return peak. The measurements were made in the same area one after the other yet they show a large variation in response. The variation is caused by changes in the geometry between the probe and material and serves to demonstrate the limit on the repeatability of UT measurements on degraded steel. The repeatability is not caused by limitations in the instrument but is determined by the quality of the material under test. A reliable measurement could be made at this location but it required the inspection of the amplitude plots to help determine which was the most reliable value.
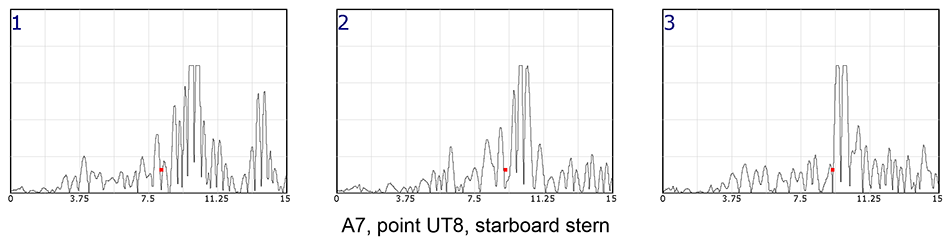
Figure 17: Three measurements made at point UT8 using the high frequency twin crystal probe (2)
Tests were done using the boiler plate to see if in-situ corrosion layers on the back face of the metal had any effect but no difference was found in the quality of the measurements if the corrosion layer was in place or had been removed. As the presence of any corrosion on the front face of the metal severely attenuates the signal from the probe it appears that corrosion layers do not couple ultrasonic signals well, so their presence on the back wall of the metal should have no effect.
For all of the tests the sound speed value for mild steel (5920 ms-1) was used even though for some samples the material type was unknown. The tests were intended to determine the ability to make ultrasonic thickness measurements and to investigate the quality of the measurements rather than to determine the degree of fit with the true sample thickness.
Test 4 Conclusions
These tests have demonstrated that the ability to make a thickness measurement lessens as material degrades. On poorer quality samples it is important to make an assessment of the quality of repeat measurements before attempting to measure variation within a small area or across an entire wreck. The single crystal multiple echo method works on good to average quality metal surfaces but on poorer quality surfaces it is harder to make a measurement . The twin crystal single echo method will produce results on poorer quality metal surfaces but it is essential that a minimum of three measurements per point are made when using the twin crystal probe so quality and measurement error can be assessed. On poor quality materials the low SNR of the signals being used to make measurements means that the ability to inspect logged traces using the CygLink software is essential for post-dive analysis of measurement quality.
Test 5 - Backfilling with Epoxy
Method
On the A7 submarine the holes in the concretion scale made at each measurement point were backfilled with epoxy putty to minimise local corrosion of the exposed metal. Wessex recommended the use of Aquastik epoxy but this is expensive and could only be bought in large quantities, so the cheaper and more readily available Milliput epoxy was used instead.
Each pack of Milliput contains two 57g sticks of different colours. To use the putty, equal quantities of each stick are mixed together to a soft and sticky paste which gradually hardens over time without shrinking. The putty will stick to metals, concretion, wood, ceramics, plastics and glass, but most importantly it will also adhere to wet and corroded iron and steel. The epoxy will set under water with the speed of hardening dependant on temperature; in water 12° C the Milliput could still be moulded for up to one hour after mixing. Milliput can be mixed under water but in tests we found that it was difficult to mix the two parts evenly so mixing on the surface just before the dive was preferred. Although the manufacturers advertise that Milliput can be used underwater we tested a batch in seawater for a month before using it on the project. The tests showed that the epoxy would adhere to corroded steel, would set completely after four hours and remained visibly unaffected by seawater after a one month immersion.
With the tests complete the epoxy was used to repair holes chiselled into the concretion on the submarine. Balls of epoxy 30mm in diameter were mixed on the surface just before the start of the dive before being placed in a re-sealable plastic bag with a little seawater to stop them sticking together. Once underwater, when a hole needed to be filled a ball of mixed epoxy was taken from the plastic bag and firmly pushed into the hole in the concretion using hands rather than tools, ensuring that the epoxy was firmly pushed into the sides of the hole to secure it firmly and to stabilise any loose concretion around the edges of the hole. Inspection of the first batch of epoxy on a subsequent day showed that it had set solid and could not be pried from the hole in the concretion without tools. Prior to making some repeat thickness measurements one of the epoxy patches was prised from the hole with a dive knife some weeks after it was placed and it came away cleanly without disrupting the surface of the metal or the surrounding concretion.
Test 5 Conclusions
In conclusion we found that the Milliput epoxy fulfilled all of our requirements for sealing and stabilising holes in concretion. The cheaper Milliput epoxy putty performed well enough in the tests so that the more expensive Aquastik need not be used.
Conclusions
The conclusions of the tests are:
- The Cygnus DIVE Mk. 2 gauge is a suitable instrument to use for thickness testing for UCH work
- Remove all concretion before making any UT measurements, the method does not work if you do not
- The simple hammer and chisel method worked well for removing concretion on all of the metal samples tested
- Use the single crystal probe on good to average quality metal
- Use the twin crystal probe on average to poor quality metal
- Make a minimum of three repeat measurements at each sample point
- Inspect the measurement plots in post processing to ensure good quality control
- Calculate the variation in measurements at each sample point and use the value when calculating changes in metal thickness over time or across a site
- Use Milliput epoxy for repairing holes made in concretion
References
- Holt P., 2015, HM Submarine A7, An Archaeological Assessment, BAR British Series no. 613, Oxford, ISBN 978 1407 31374 0
- Russell M., Conlin D., & Murphy L., 2006, A Minimum-Impact Method for Measuring Corrosion Rate of Steel-Hulled Shipwrecks in Seawater, International Journal of Nautical Archaeology 35.2: 310–318
- Smith T., 2008, Report of Operation Silent ANZAC Maritime Archaeological Assessment Of HMAS AE2, available at http://ae2.org.au/resources/research/, accessed Oct. 2016
- Wessex Archaeology, 2012, Ultrasonic Thickness Measurement Methodology Development and Testing. HM Submarines Holland No. 5 and A1, Unpublished report, Ref: 83800.23